Visualization - Graphical Evaluation
 Along
with the numerical output formally
required by EN ISO 10211 further extensive graphical
evaluation (visualization) of the calculated results can be obtained and
eventually passed to printer or other applications.
Along
with the numerical output formally
required by EN ISO 10211 further extensive graphical
evaluation (visualization) of the calculated results can be obtained and
eventually passed to printer or other applications.
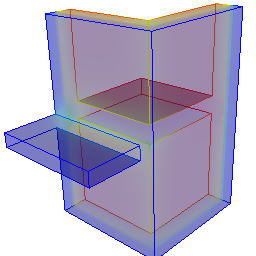
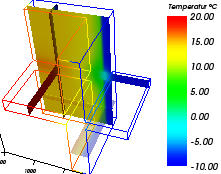
Quick view onto the calculated temperature distribution of the component can be obtained in the form of "false coloured" visualizations. For a two dimensional case there is only one such image, three dimensional cases can be visualized with slices through the model or arbitrary view onto the construction.
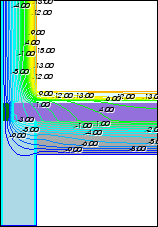 Some
more detailed representation of the temperature distribution is available as
isotherm images. Isotherms,
i.e. lines of constant temperature, will be shown on the slice through the
construction for a two dimensional model. Detailed appearance and content of the
information shown can be defined by the user by defining the number of isotherms
drawn - value of the first and last isotherm, interval between consecutive
isolines etc. can be used to define the meaning of each particular isotherm..
Some
more detailed representation of the temperature distribution is available as
isotherm images. Isotherms,
i.e. lines of constant temperature, will be shown on the slice through the
construction for a two dimensional model. Detailed appearance and content of the
information shown can be defined by the user by defining the number of isotherms
drawn - value of the first and last isotherm, interval between consecutive
isolines etc. can be used to define the meaning of each particular isotherm..
For a three dimensional case the slice plane at which isotherms shall be drawn can be arbitrarily chosen. Furthermore isotherms can be shown on the surface of the model to emphasize the temperature distribution also.
Furthermore, one can query the value of temperature at any arbitrary point of the construction. The definition of points of interest is either provided by the coordinate entry via the menu "Probe points" or by setting the position of slice planes - the temperature value at the intersection the three planes will be shown on the screen.
Further evaluation of temperatures can be available as a graph of temperature values along an edge (surface) of one particular space in two dimensional case. (Remark! This option is currently not available!)
For three dimensional cases one shall request the graph of temperature values along arbitrary line (eventually parallel to coordinate axes). Such line might intersect the interior of the component or follow the surface of the construction - thus providing the ability to emphasize temperature values at components edges.
 As
an alternative to the visualization of calculated temperature distributions one
shall request results showing dew point values (condensing humidity values)
resulting from the current temperatures on the surfaces of the model. To achieve
that simple activation of the switch
"secondary
functions" is required followed by the selection of "Relative Humidity %"
within the box "Active
function". This visualization provides by far much more information compared
to the norm required printout "Results"
because not only the "yes-no-decision" of norm conformant construction can be
received, but additional, much more detailed conclusions about the distribution
of dew point values at component's surfaces are possible.
In particular, for construction non conformant to standards, the ability to draw
an
isoline at the humidity value
which is critical by the standard (the value above which the condensation or
mould growth shall occur) might be very instructive. Such an
isoline will mark and
emphasize the critical area of the components
surface.
As
an alternative to the visualization of calculated temperature distributions one
shall request results showing dew point values (condensing humidity values)
resulting from the current temperatures on the surfaces of the model. To achieve
that simple activation of the switch
"secondary
functions" is required followed by the selection of "Relative Humidity %"
within the box "Active
function". This visualization provides by far much more information compared
to the norm required printout "Results"
because not only the "yes-no-decision" of norm conformant construction can be
received, but additional, much more detailed conclusions about the distribution
of dew point values at component's surfaces are possible.
In particular, for construction non conformant to standards, the ability to draw
an
isoline at the humidity value
which is critical by the standard (the value above which the condensation or
mould growth shall occur) might be very instructive. Such an
isoline will mark and
emphasize the critical area of the components
surface.
Very helpful hints regarding improvement of the thermal quality of building construction result from the visualization of heat streams through (and within) the construction. To receive output related to heat flux one simply needs to activate the switch "Secondary functions" and then, within the box "active function" choose the "Heat stream density W/m2". Variants of visualization options available to the calculated heat stream densities are the same as to temperature distribution. Locations of high heat stream densities shall emphasize thermally weak areas of the construction and can be immediately visualized as false colour diagrams or isoline views for better identification.
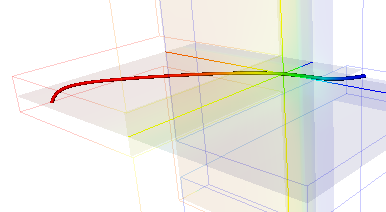
For both, the two as well as for three dimensional cases, the heat flow through the construction can be visualized with a streamline. The streamline is shown as soon as the control panel "Streamlines" is activated and coordinates of the starting point are chosen by placing the intersection of the slice planes X, Y and Z within the construction.
For two dimensional cases there is possibility to visualize multiple multiple heat flow streamlines. Since the area between the two neighbouring streamlines marks exactly the same amount of heat flow, the areas at which the density of streamlines is high emphasize potentially weak locations within the construction.
Visualisation of heat flow is also offered as
hedge hog field of vector
arrows. This display is controlled within
Vectors (HedgeHog, Arrows) control panel
by defining the mesh of points at which the direction of heat flow and
eventually its magnitude shall be shown.
See also: Evaluations and Results